Side project
Hardware
E-Paper Status Wall
A 31.2 inch monochrome e-paper panel on my living room wall that shows live health and traffic for itsnas.me, so I know the site is fine without opening a single dashboard.
 Naseebullah AhmadiSenior Software Engineer, London
- 7 min read
- Duration1 mo
- Last updated
The impact, in numbers
- Panel, edge to edge
- 31.2 in
- Poster-sized, readable from the sofa.
- Data refresh
- 1 min
- One small JSON fetch, cached on the site.
- Longest gap between redraws
- 15 min
- A status change redraws straight away.
- Dashboards opened each evening
- 0
- The answer is already on the wall.
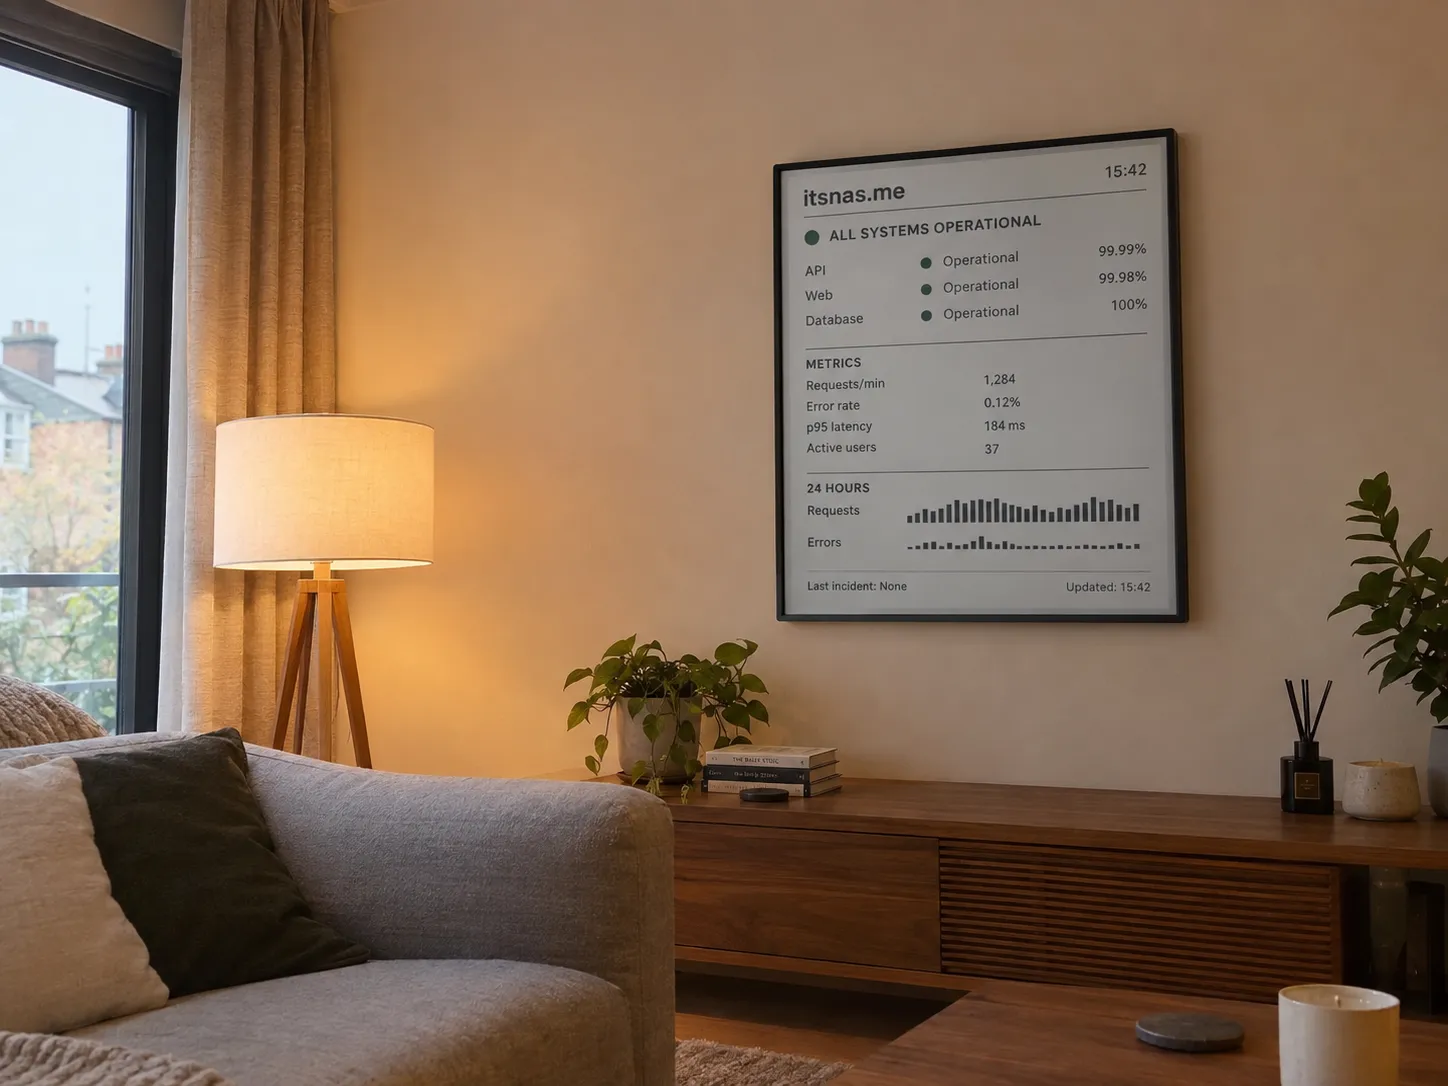
A 31.2 inch monochrome e-paper panel, mounted upright in a black frame above the sideboard in my living room: roughly 40 by 70 cm of screen, about the size of a framed poster. It shows the state of this site: whether each part is up, how much traffic it's taking, how fast it's answering, and whether anything has gone wrong in the last 24 hours.
Why I wanted it
I kept doing the same thing every evening: open the #vercel dashboard, open #sentry, glance at analytics, close all three. Nothing was ever wrong, which is exactly why it felt like a waste. What I wanted was the answer without the ritual, somewhere I'd see it in passing.
A spare tablet on the wall was the obvious option, and the wrong one. A backlit screen glows all night and looks like a gadget. I wanted something that reads like a printed poster and only draws attention when the content changes.
Choosing the hardware
E-paper fit that brief: it reflects light instead of emitting it, and it only draws real power while redrawing. The catch is size. Most hobby panels are badge-sized (2 to 7 inches), and even the 13.3 inch panels sold as Raspberry Pi add-ons are about the size of a small laptop screen: fine on a desk, unreadable from the sofa. I wanted something that holds its own on a wall.
- 1
A signage panel, not a hobby one
Good Display's 31.2 inch panel (the GDEP312TT3) uses E Ink Carta 1300, the same film used in large e-paper signs: 2560x1440 at 16 grey levels, with an active area of about 691 x 389 mm. Hung upright, the headline status reads from across the room and the detail reads from a step closer.
- 2
Monochrome over colour
Colour e-paper at this size is slower to redraw and much more expensive, and status only needs two states anyway: fine, or not.
- 3
A USB driver board, so any computer can drive it
A panel this big needs its own timing controller. Its matching board, the DEXWM-C32, takes 12 V and exposes the panel over USB to Windows, Android or Linux, so the computer behind it doesn't need any special header: a Raspberry Pi 4 has plenty of headroom for a small native UI app.
The full parts list:
| Part | What I used |
|---|---|
| Panel | Good Display 31.2 inch e-paper, 2560x1440, 16 grey levels |
| Controller | DEXWM-C32 driver board, USB, 12 V input |
| Computer | Raspberry Pi 4 (2 GB) running Raspberry Pi OS Lite |
| Power | One 12 V 3 A supply, with a 12 V to 5 V converter for the Pi |
| Frame | Shallow black box frame, about 50 x 80 cm, with a cut mount |
| Hanging | A French cleat screwed into the wall, so the frame sits flush |
Building it
The panel is a large sheet of glass under a millimetre thick, with a flat ribbon cable (FPC) running from one edge into the driver board. At this size, building it is mostly about not breaking it.
- 1
Seat the panel's ribbon cable in the driver board's connector and lock the latch.
- 2
Connect the board to the Pi over USB, power both from the 12 V supply, and show a test image before anything goes in the frame.
- 3
Lay the frame face down with the mount in place, lower the panel onto it, and back it with a full sheet of foam board so the glass is supported edge to edge.
- 4
Fix the driver board, the Pi and the converter to the foam board, with the ribbon cable lying flat and slack.
- 5
Hang the frame on the cleat and run the single power cable down behind the sideboard.
Programming it
There's no browser and no rendered image coming from a server. The panel's UI is a small native app on the Pi, written in C with #lvgl, an embedded UI library built for exactly this kind of screen. Everything in the photo is one of its built-in widgets: the status dots are LEDs, the metric block is a table, the 24 hour charts are bar charts, and the rest are labels.
The site sends data, not layout. The app fetches one small JSON document a minute and sets each widget's value from it; the widgets draw themselves. Designing for e-paper came down to a few constraints:
- 1
Fixed size, no responsiveness
The layout is built for exactly 1440x2560, the panel turned to portrait, so every font size and gap is chosen for one screen read from across a room.
- 2
Heavy type and solid shapes
The panel's 16 greys render clean text, but anything thinner than a couple of pixels looks fuzzy from the sofa. The theme uses heavy fonts, thick rules and solid bars, and black, white and a couple of greys, nothing else.
- 3
No animation
LVGL animates by default (pressed states, value changes, scrolling), and every frame of an animation would be a full redraw here, so the theme turns it all off.
Getting it onto the panel
LVGL draws into a buffer in memory and only re-renders the areas that changed, then hands them to a flush function that I write. That function is the only part that knows about the hardware: it converts the buffer to the panel's 16 greys and sends the frame to the driver board over USB.
That makes the redraw rule fall out of the UI library instead of being bolted on. The board redraws the whole screen on every update, and a full e-paper redraw flashes black and white before it settles; redrawing every minute made the wall blink like a broken light. So the app only sets a widget when its displayed text actually changes (numbers are rounded to what the layout shows first), and a flush only happens when some widget changed. A status change always flushes straight away, and the "Updated" time forces one at least every 15 minutes so it never looks stale.
The cost of this approach is that the layout lives on the device: changing the design means rebuilding the app on the Pi, not deploying the site. In exchange, the wall has no browser to keep alive and no dependency on the site being up to draw anything at all.
Connecting it to the site
The app never talks to Vercel or Sentry directly. A single endpoint on the site gathers everything and returns one small, flat document: status per component, requests per minute, error rate, p95 latency, active users, the 24 hour series for the bar charts, and the last incident. That document is the contract between the site and the wall: as long as its shape holds, either side can change without the other.
The endpoint is behind a token and caches its answer for a minute, so the panel can't become a source of load on the thing it's watching. If a fetch fails, the app keeps the last good values and switches the "Updated" label to "stale" instead of going blank; an empty screen would look the same as everything having broken.
Living with it
After a few weeks, the habit is gone: I don't open the dashboards in the evening any more, because the answer is already on the wall.
It earns its place on the bad days, not the good ones. The first time the error bars grew, I noticed it walking past, before any alert fired, and the fix was in before it turned into anything worth writing an incident about. A quiet screen has become the signal that I can stop thinking about work.
The one change I'd make is less, not more. I keep wanting to add numbers, and every one I add makes the screen slower to read. The useful version answers "is it fine?" from across the room; everything else is for when I walk over.